Suppose you have a Kubernetes cluster with GPUs. You want to deploy a language model, expose an endpoint, and let an application use it to summarize documents.
Then the tool names start arriving: NVIDIA Dynamo, vLLM, AI Runway, Argo CD, Headlamp, Prometheus, Grafana, Loki.
Which one runs the model? Which one creates the deployment? And which one do you open when an answer takes too long?
The key is that these tools do not form one long chain that every request passes through. Some create and maintain the service. Some handle inference requests. Others help you understand what is happening.
This article separates those jobs, using one model service in a Kubernetes cluster as the example.
The Stack at a Glance
Inference means using an already-trained model to produce an answer. Model serving means making that inference available to applications over a network.
For a Dynamo-based deployment, the responsibilities look like this:
| Piece | Its job |
|---|---|
| Kubernetes | Run and maintain the containers, networking, and resource allocations |
| Dynamo Operator | Turn a Dynamo deployment description into Kubernetes workloads |
| Dynamo Frontend and routing | Accept inference requests and direct work to model workers |
| Model workers using vLLM, SGLang, or TensorRT-LLM | Run the model computation on GPUs |
| AI Runway, optional | Provide a model-oriented deployment UI and higher-level API |
| Git and Argo CD, optional | Record desired configuration and synchronize it to the cluster |
| Headlamp, optional | Provide a UI for inspecting live Kubernetes resources |
| Prometheus, Loki, and Grafana | Collect, store, and display operational evidence |
Think of an inference service as a factory. The model workers operate the machines. Dynamo coordinates the flow of orders. Kubernetes keeps the underlying workloads running. The deployment tools maintain the plan, and the monitoring tools show how the factory is performing.
The analogy helps with orientation. The actual boundaries matter more.
1. Kubernetes Provides the Foundation
Kubernetes schedules containers onto machines, restarts failed containers, connects services, and makes configured storage and hardware resources available.
Two Kubernetes terms appear throughout the stack:
- A Pod runs one or more containers together. A Dynamo worker runs in a Pod, which may request one or more GPUs.
- A Service provides a stable network address for a set of Pods, even as individual Pods are replaced.
GPU nodes also need the appropriate drivers and Kubernetes GPU integration. For NVIDIA GPUs, a device plugin commonly makes GPUs available as schedulable resources; the NVIDIA GPU Operator can manage much of that setup. A request for a GPU does not create hardware that the cluster lacks.
Kubernetes understands that a Pod needs a GPU. It does not inherently understand which worker has useful cached prompt state or how to split the work of generating an answer. Those are inference-specific decisions.
Helm and kubectl are tools for working with this foundation. Helm packages Kubernetes configuration into reusable installations. kubectl is the command-line client for applying configuration and inspecting resources, events, and logs. Neither runs the model.
2. The Dynamo Operator Creates the Serving Deployment
Before the cluster can serve a request, it needs a description of what should run.
Dynamo introduces a Kubernetes resource type called DynamoGraphDeployment. An individual object of that type describes a serving deployment, including components such as its frontend and workers.
The word graph refers to the connected serving components. It does not mean there is a graphical editor.
Kubernetes learns this resource type through a Custom Resource Definition, or CRD. The distinction is useful: the CRD defines the type; your deployment object describes one instance of it.
The Dynamo Operator watches these deployment objects and creates or updates the Kubernetes resources they require. An operator is a controller that repeatedly works to make the running system match its declared configuration. This is called reconciliation.
For our document-summary service:
- We submit a
DynamoGraphDeploymentdescribing the frontend, model workers, container images, and resource requirements. - The Dynamo Operator creates the corresponding workloads and supporting resources.
- Kubernetes schedules the Pods onto suitable nodes.
- The workers load the model and the components become ready to serve requests.
The deployment object describes the service. The operator builds and maintains it. The running components serve requests.
The operator is not a stop on the path of every prompt. It manages the lifecycle of the components that handle those prompts.
3. The Frontend and Workers Handle Requests
Once the service is ready, the application can ask it to summarize a document.
The Frontend Is an API Server, Not a Dashboard
The Dynamo Frontend accepts OpenAI-compatible inference requests. Compatible describes the API format; it does not mean the request goes to OpenAI.
Despite its name, it is not a web page for deploying models. It is the network entry point for inference. Your application, or a separate chat UI, supplies the interface a person sees.
Workers Run the Model
A worker uses a model-serving runtime such as vLLM, SGLang, or TensorRT-LLM to execute the model on GPUs. These are alternative backends, not three mandatory components you install in a sequence.
The runtime handles model execution and work such as batching requests. Dynamo coordinates work around the runtimes, including request routing and more advanced distributed serving arrangements.
The basic request path is:
- Application: sends a document and a request to summarize it.
- Dynamo Frontend and routing: accept the request and select an appropriate worker.
- Model worker: processes the prompt and generates the answer on GPUs.
- Dynamo Frontend: returns the answer, potentially streaming it as it is generated.
Argo CD, AI Runway’s deployment UI, Headlamp, and Grafana do not relay each prompt through this path.
If callers are outside the cluster, you also need an appropriate way to reach the endpoint, such as an ingress or gateway. Authentication, TLS, and access controls belong in that access design; having an inference API does not make it safe to expose publicly.
More Advanced Deployments Split the Work
Generating an answer has two main stages:
- Prefill: process the input prompt and build the model’s attention state.
- Decode: use that state to generate output tokens, or pieces of text, one at a time.
The saved attention state is called the key-value cache, or KV cache. Reusing suitable cached state can avoid repeating some prompt-processing work. KV-cache-aware routing considers where reusable state exists when selecting a worker.
In a simple deployment, the same worker handles prefill and decode. In a disaggregated deployment, separate worker pools handle them. That can help tune capacity for the two stages independently, but also introduces state-transfer and coordination costs.
Dynamo also has planning and scaling capabilities for supported configurations. These are not all enabled merely by installing the operator. The chosen deployment determines which components and behaviors you use.
NVIDIA’s vLLM deployment examples show these different arrangements. For understanding the architecture, start with a frontend and combined prefill/decode workers. Add the split only when you need to reason about it.
4. AI Runway and Argo CD Manage Deployment Intent
Both tools can affect what gets deployed, but they solve different problems.
AI Runway: Describe the Model Service
AI Runway provides a web UI and a higher-level Kubernetes resource called ModelDeployment. It supports multiple inference providers, including Dynamo.
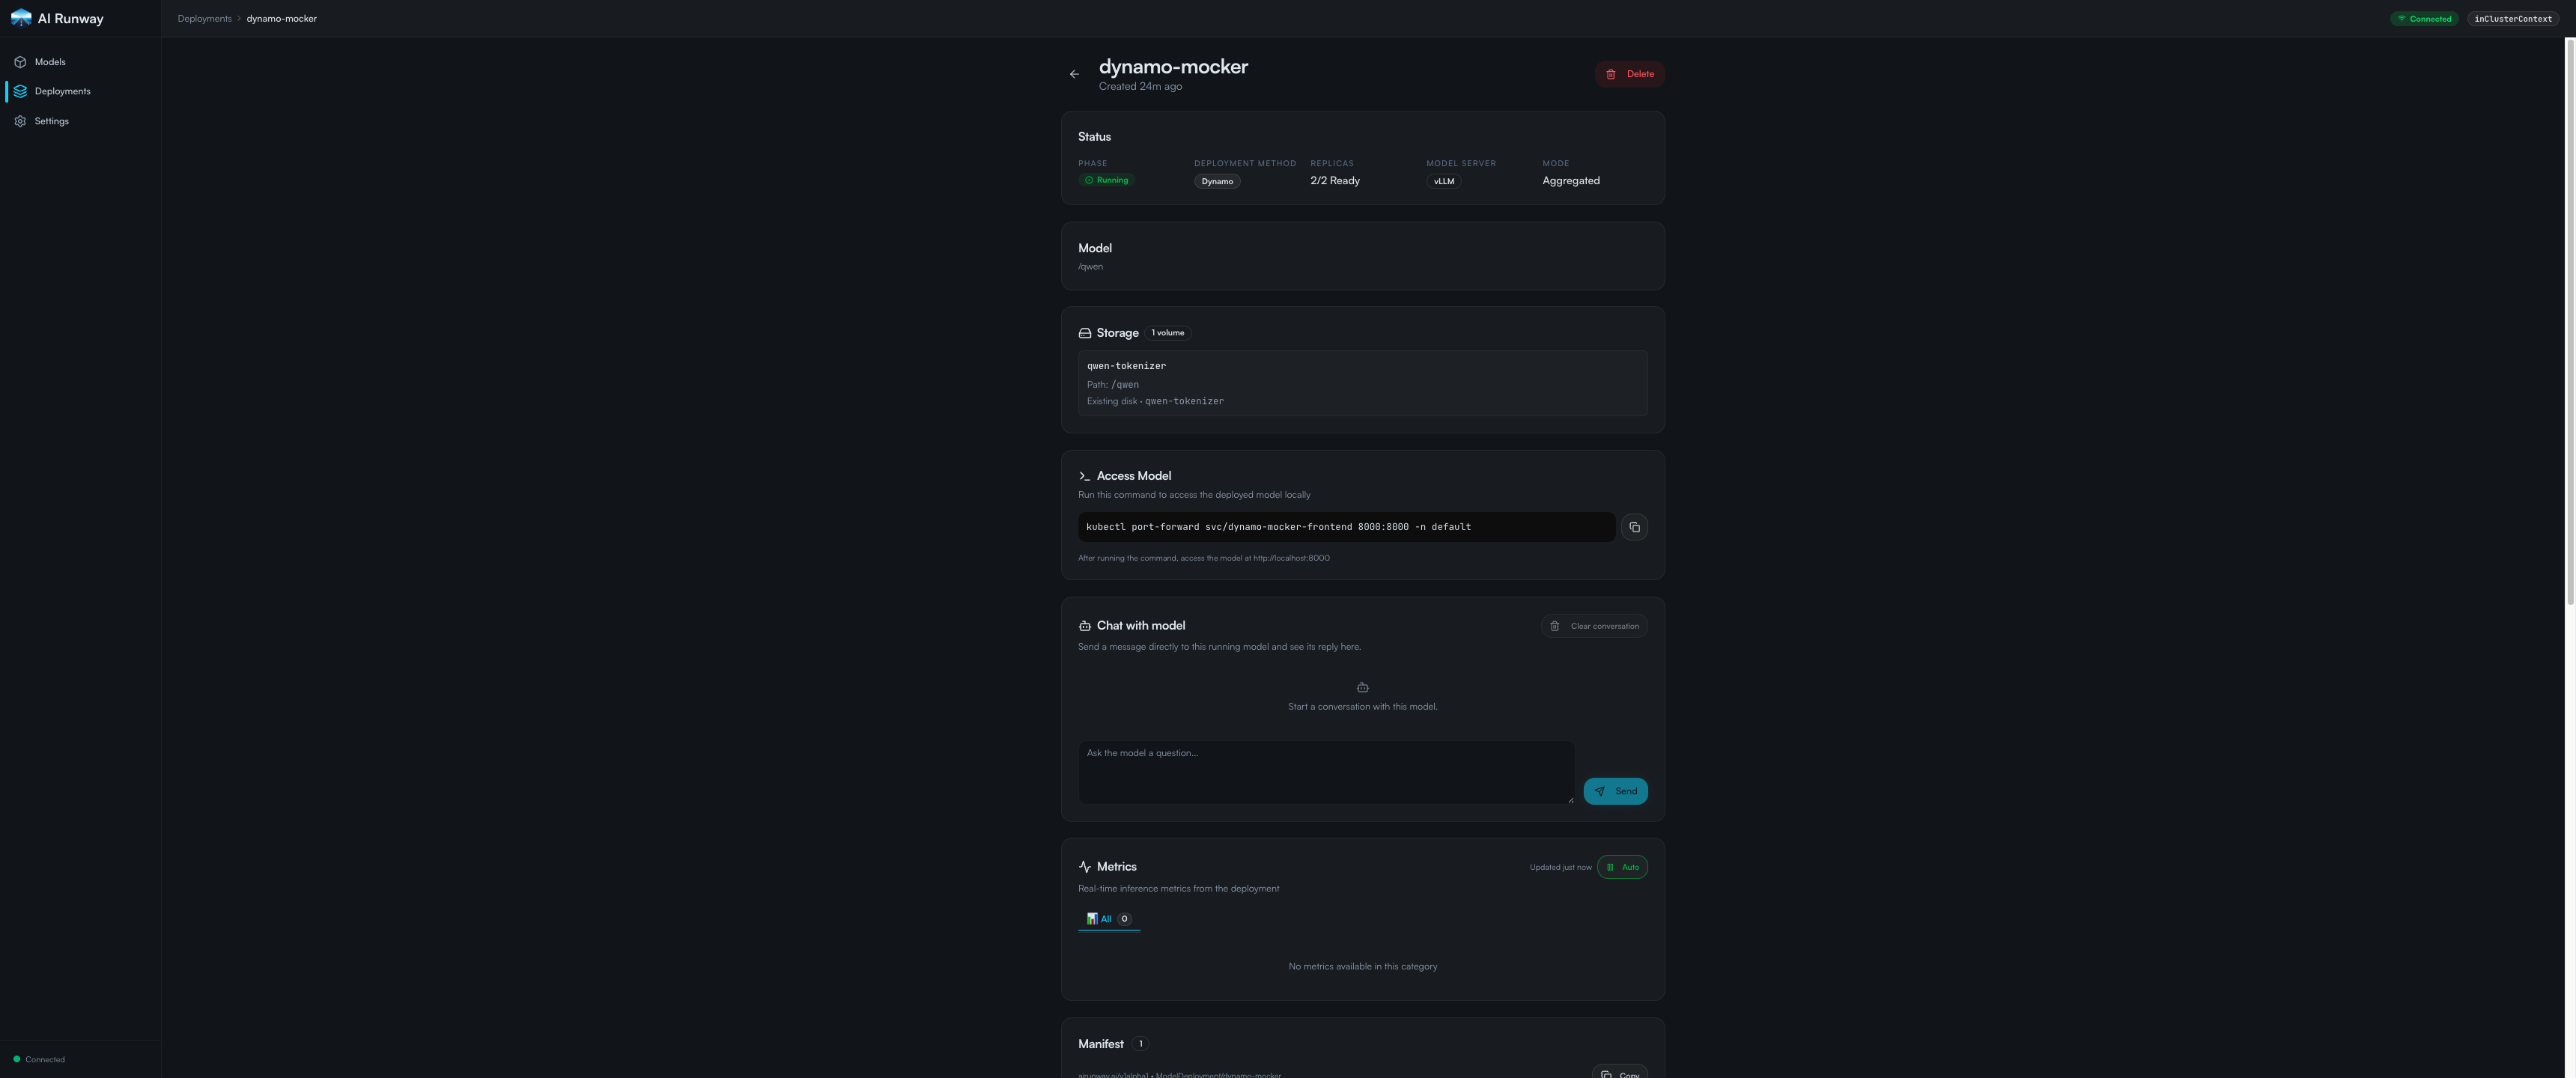
AI Runway provides the model-oriented view of deployment.
Instead of starting with a detailed Dynamo deployment, you start with the model you want to serve and its deployment settings. With the Dynamo provider configured, AI Runway’s controller and provider integration translate that intent into Dynamo-specific resources.
There are two levels of description:
ModelDeployment: the model service you want, expressed through AI Runway’s API.DynamoGraphDeployment: the Dynamo serving components that implement it.
AI Runway is optional. You can submit Dynamo deployment objects directly without it. Its project also notes that its APIs are evolving, so check provider compatibility with the versions you install.
Argo CD: Synchronize Configuration From Git
Argo CD compares configuration stored in Git with what exists in Kubernetes. It can apply changes through a manual sync or automatically, depending on configuration.
This is GitOps: Git records the desired configuration, and a controller synchronizes the cluster with it. Review and approval happen in your change process; Argo CD does not approve a commit merely by seeing it.
For a direct Dynamo deployment, the path is:
- Change the
DynamoGraphDeploymentconfiguration in Git. - Review and merge the change.
- Argo CD synchronizes it to Kubernetes.
- The Dynamo Operator reconciles the updated object.
- The running service changes accordingly.
Give Each Controller a Clear Owner’s Job
If you use AI Runway and Argo CD together, choose which configuration Git owns.
One arrangement is to store the parent ModelDeployment in Git. Argo CD manages that object, AI Runway manages the generated Dynamo deployment, and the Dynamo Operator manages the resulting workloads.
Avoid independently managing the same generated configuration with multiple tools. A manual change to a worker Pod, for example, may be replaced by its controller. A UI change to a Git-managed field may be overwritten by a later Argo CD sync.
Make lasting changes at the level that owns the configuration.
5. Headlamp Shows the Live Kubernetes State
Headlamp is a Kubernetes UI for inspecting resources, status, events, and container logs. Available actions depend on your Kubernetes permissions.
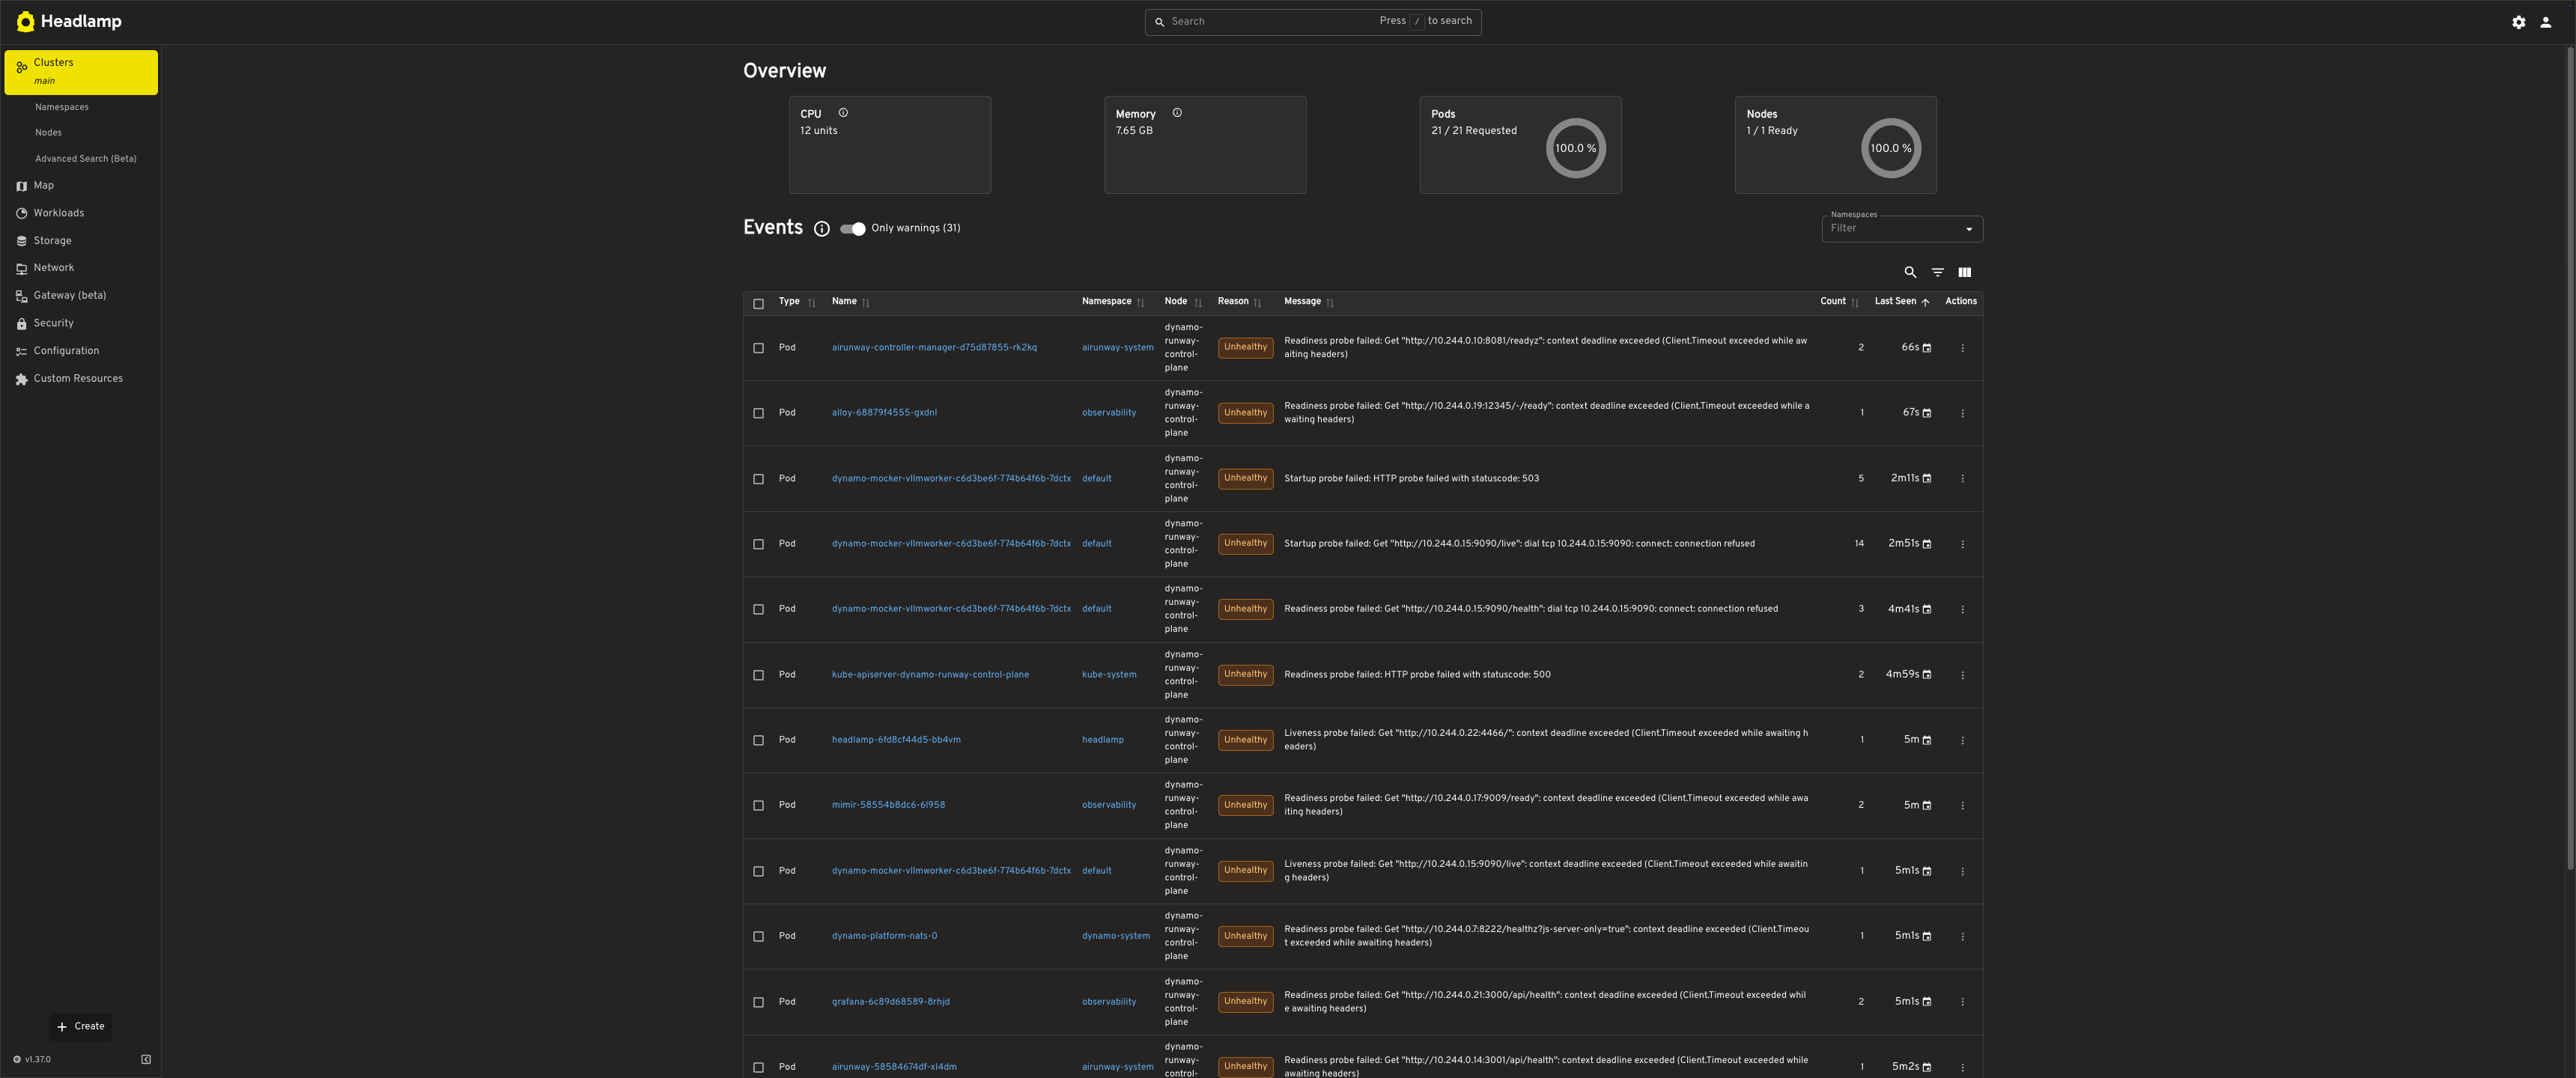
Headlamp provides the live Kubernetes view of the resources behind the model service.
Suppose our document-summary endpoint never becomes ready. Headlamp helps answer:
- Does the
DynamoGraphDeploymentexist, and what status does it report? - Were worker Pods created?
- Is a Pod waiting because no suitable GPU is available?
- Did its container image fail to download?
- Did the worker start but fail while loading the model?
The distinction from Argo CD is emphasis: Argo CD compares the running system with the desired configuration; Headlamp helps inspect the running system itself. Their capabilities overlap, but neither tells the whole story of inference performance.
You can investigate many of the same Kubernetes questions with kubectl. Headlamp gives you a visual interface, not a separate source of truth.
6. Prometheus, Loki, and Grafana Explain Behavior Over Time
A Pod can be running while the service is slow. That is why resource inspection and performance monitoring are separate jobs.
| Tool | Responsibility | Example |
|---|---|---|
| Prometheus | Collect and store numeric measurements over time | Request rate, queue size, response latency |
| Loki | Store and make collected logs searchable | A worker’s model-loading error |
| Grafana | Query data sources and display the results | A latency chart beside related worker logs |
Grafana is the interface, not a substitute for collecting and storing the data. Prometheus needs reachable metric endpoints. Loki needs a configured log collector. GPU measurements may require an exporter, a component that exposes hardware metrics for collection.
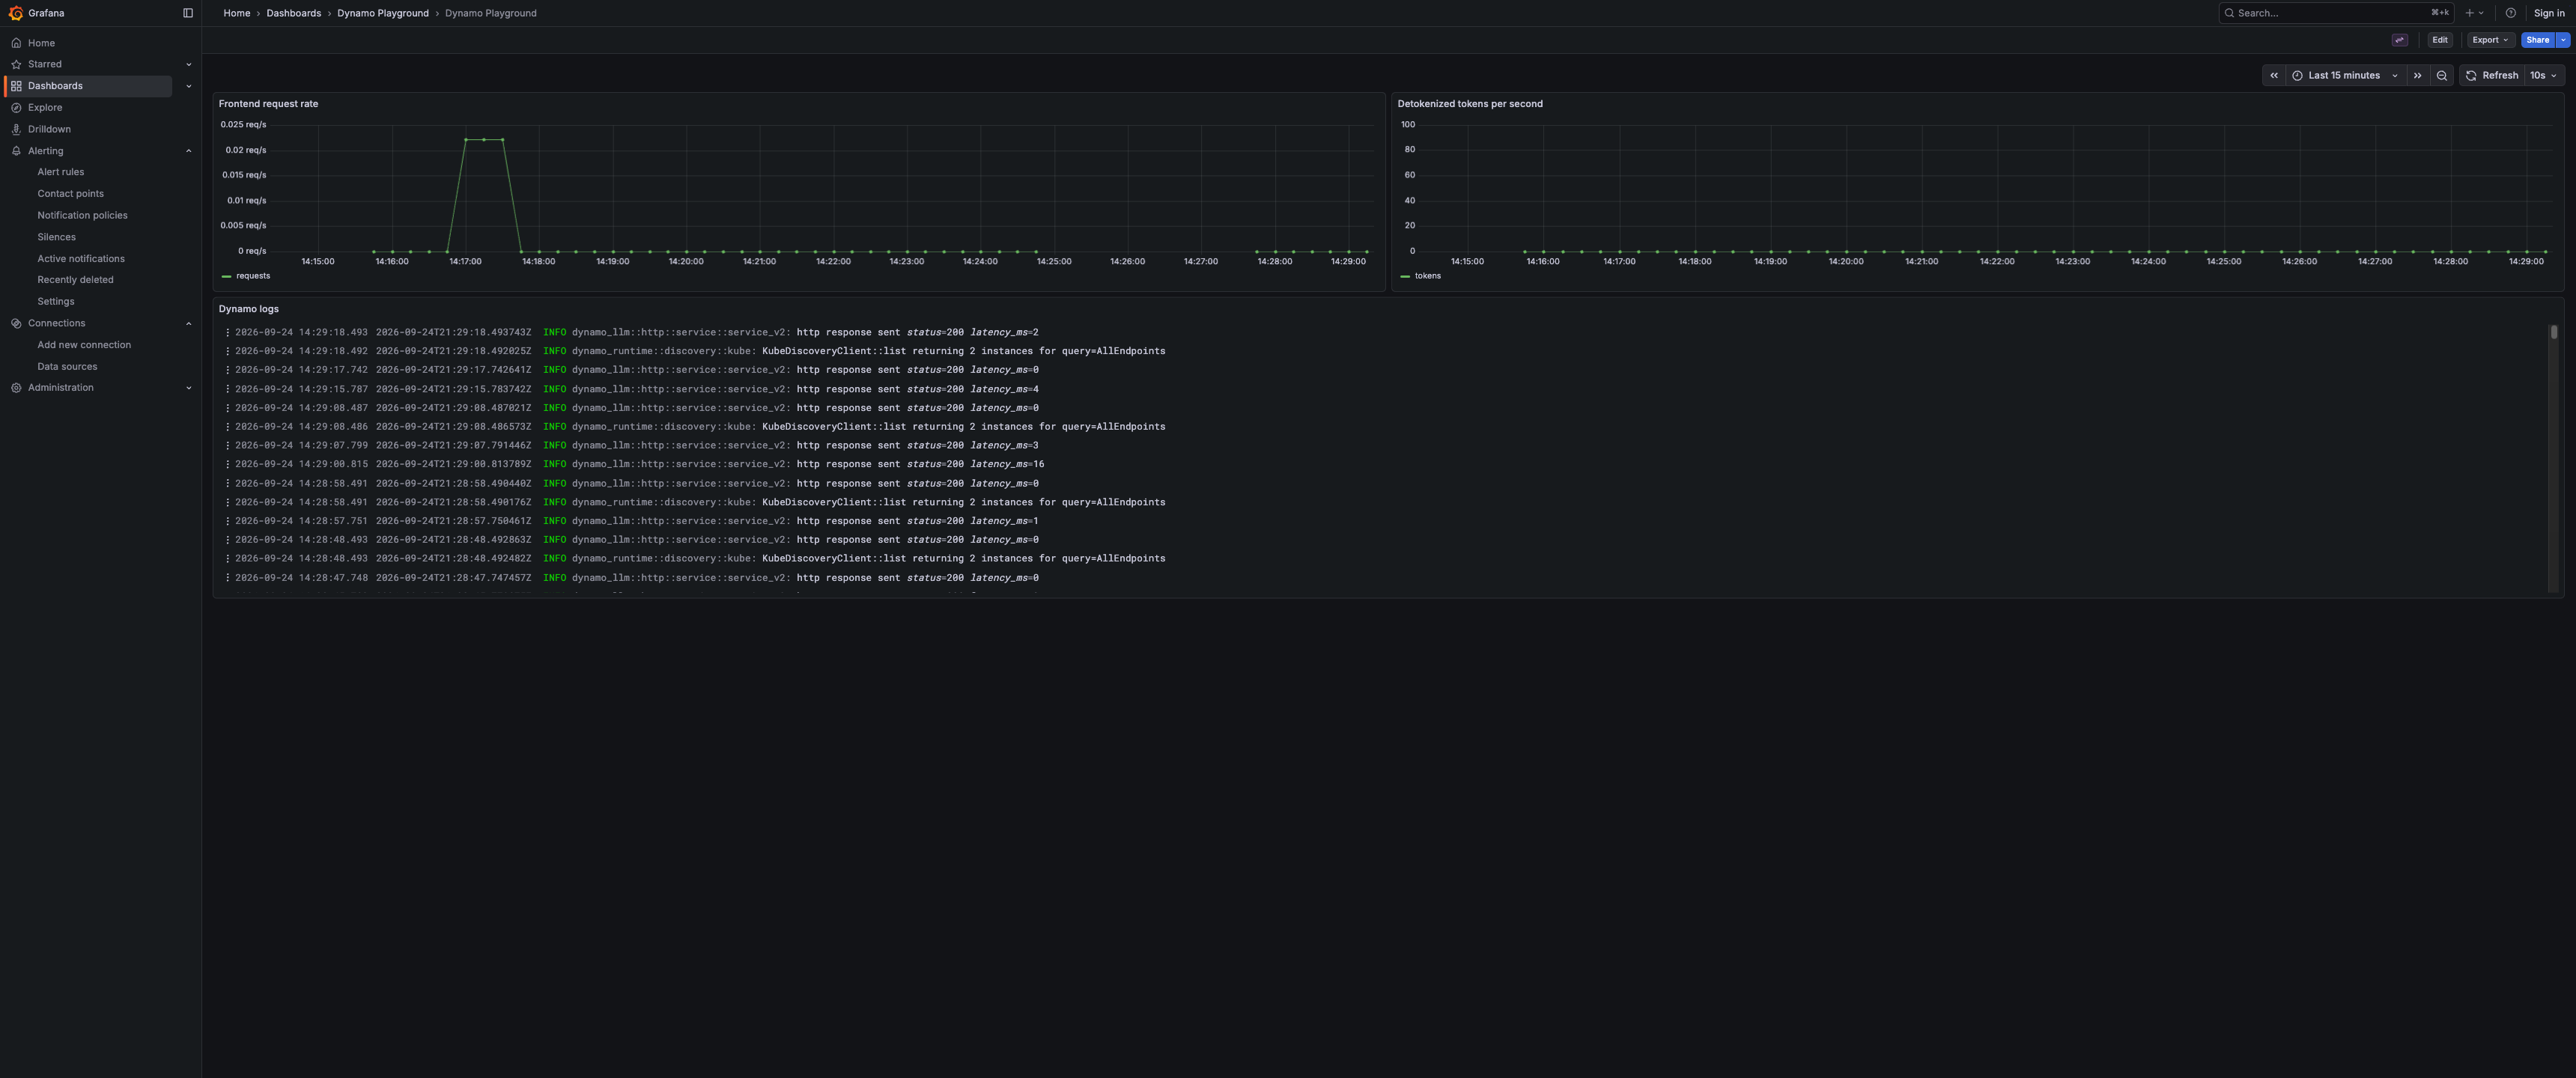
Grafana provides the operational view, using data from the monitoring systems connected to it.
NVIDIA’s observability guide describes Dynamo application metrics, operator metrics, and logging integration. Installing Dynamo alone does not install and connect the entire monitoring stack.
For a slow document-summary service, a useful investigation is:
- Grafana: find when time to first token increased. This measures how long users wait before the answer starts appearing.
- Metrics from Prometheus: compare request volume, queue size, and available worker capacity. High GPU utilization alone does not prove the cause.
- Headlamp: inspect affected Pods for restarts, scheduling failures, or readiness problems.
- Logs in Loki, viewed through Grafana: read messages from those workers in the same time window.
- Argo CD and Git: check whether configuration changed around that time. A nearby rollout is evidence to investigate, not proof of causation.
Each tool contributes a different piece of evidence.
What You Actually Put in the Cluster
It helps to distinguish infrastructure shared across model services from the resources for one particular model.
Shared platform infrastructure typically includes GPU-enabled nodes, the required Dynamo CRDs and operator, and the supporting services required by your Dynamo release. Argo CD, AI Runway, Headlamp, and the monitoring stack can also be shared. Some interfaces can run outside the cluster while connecting to it.
Per-model resources include the deployment object and the frontend, workers, and supporting Kubernetes resources created for that service. With AI Runway, the higher-level ModelDeployment sits above those resources.
For the document-summary example, the practical decisions are:
- Choose a model-serving backend and a suitable Dynamo deployment arrangement.
- Declare the model, images, GPU requirements, and worker configuration.
- Submit that declaration directly or through a chosen deployment workflow.
- Provide the network access, credentials, and model-storage access the deployment needs.
- Verify readiness, send a request, and connect metrics and logs.
Use the installation instructions for your chosen release for exact dependencies and resource schemas. The architecture above is a map of responsibilities, not a version-specific installation recipe.
Keep These Three Paths Separate
The deployment path turns a declaration into running resources. Git, Argo CD, AI Runway, the Kubernetes API, and the Dynamo Operator participate according to the workflow you choose.
The request path turns a prompt into an answer. The Dynamo Frontend, routing, and model workers do that work.
The observation path turns runtime evidence into something you can investigate. Headlamp exposes Kubernetes state; Prometheus and Loki hold metrics and logs; Grafana helps you explore them.
When a new tool enters the picture, ask which of those jobs it owns. The stack becomes easier to understand once deployment, inference, and observation stop looking like the same process.